11
2004 2005 2006 2007 2008 2009 2010 2011 2012
3.6
3.5
3.4
3.3
3.2
3.1
500
450
400
350
300
250
200
150
100
50
0
1972
1974
1976
1978
1980
1982
1984
1986
1988
1990
1992
1994
1996
1998
2000
2002
2004
2006
2008
2010
2012
2014
2016
55%
50%
2003
2004
2005
2006
2007
2008
2009
2010
2011
2012
2013
Historic Enrollment (Professional and Graduate Programs
260
2004
2005
2006
2007
2008
2009
2010
2011
2012
1972
1974
1976
1978
1980
1982
1984
1986
1988
1990
1992
1994
1996
1998
2000
2002
2004
2006
2008
2010
2012
2014
2016
.
.
3.
3.
3.
3.
2006
2007
2008
2009
2010
2011
2012
OAT TS
100%
95%
90%
85%
80%
75%
7 %
65%
2002
2003
2004
2005
2006
2007
2008
2009
2010
2011
2012
100%
95%
90%
85%
80%
75%
70%
65%
2002
2003
2004
2005
2006
2007
2008
2009
2010
2011
2012
Entering GPA and Science GPA
NBEO Part II (Patient Assessment and Management)*
NBEO Part IIII (Clinical Skills)*
Entering GPA and Science GPA
GRADE POINT AVERAGE (GPA)
Overall GPA
Science GPA
Entering Year
National
SUNY
380
360
340
320
300
280
260
2
2
2
2
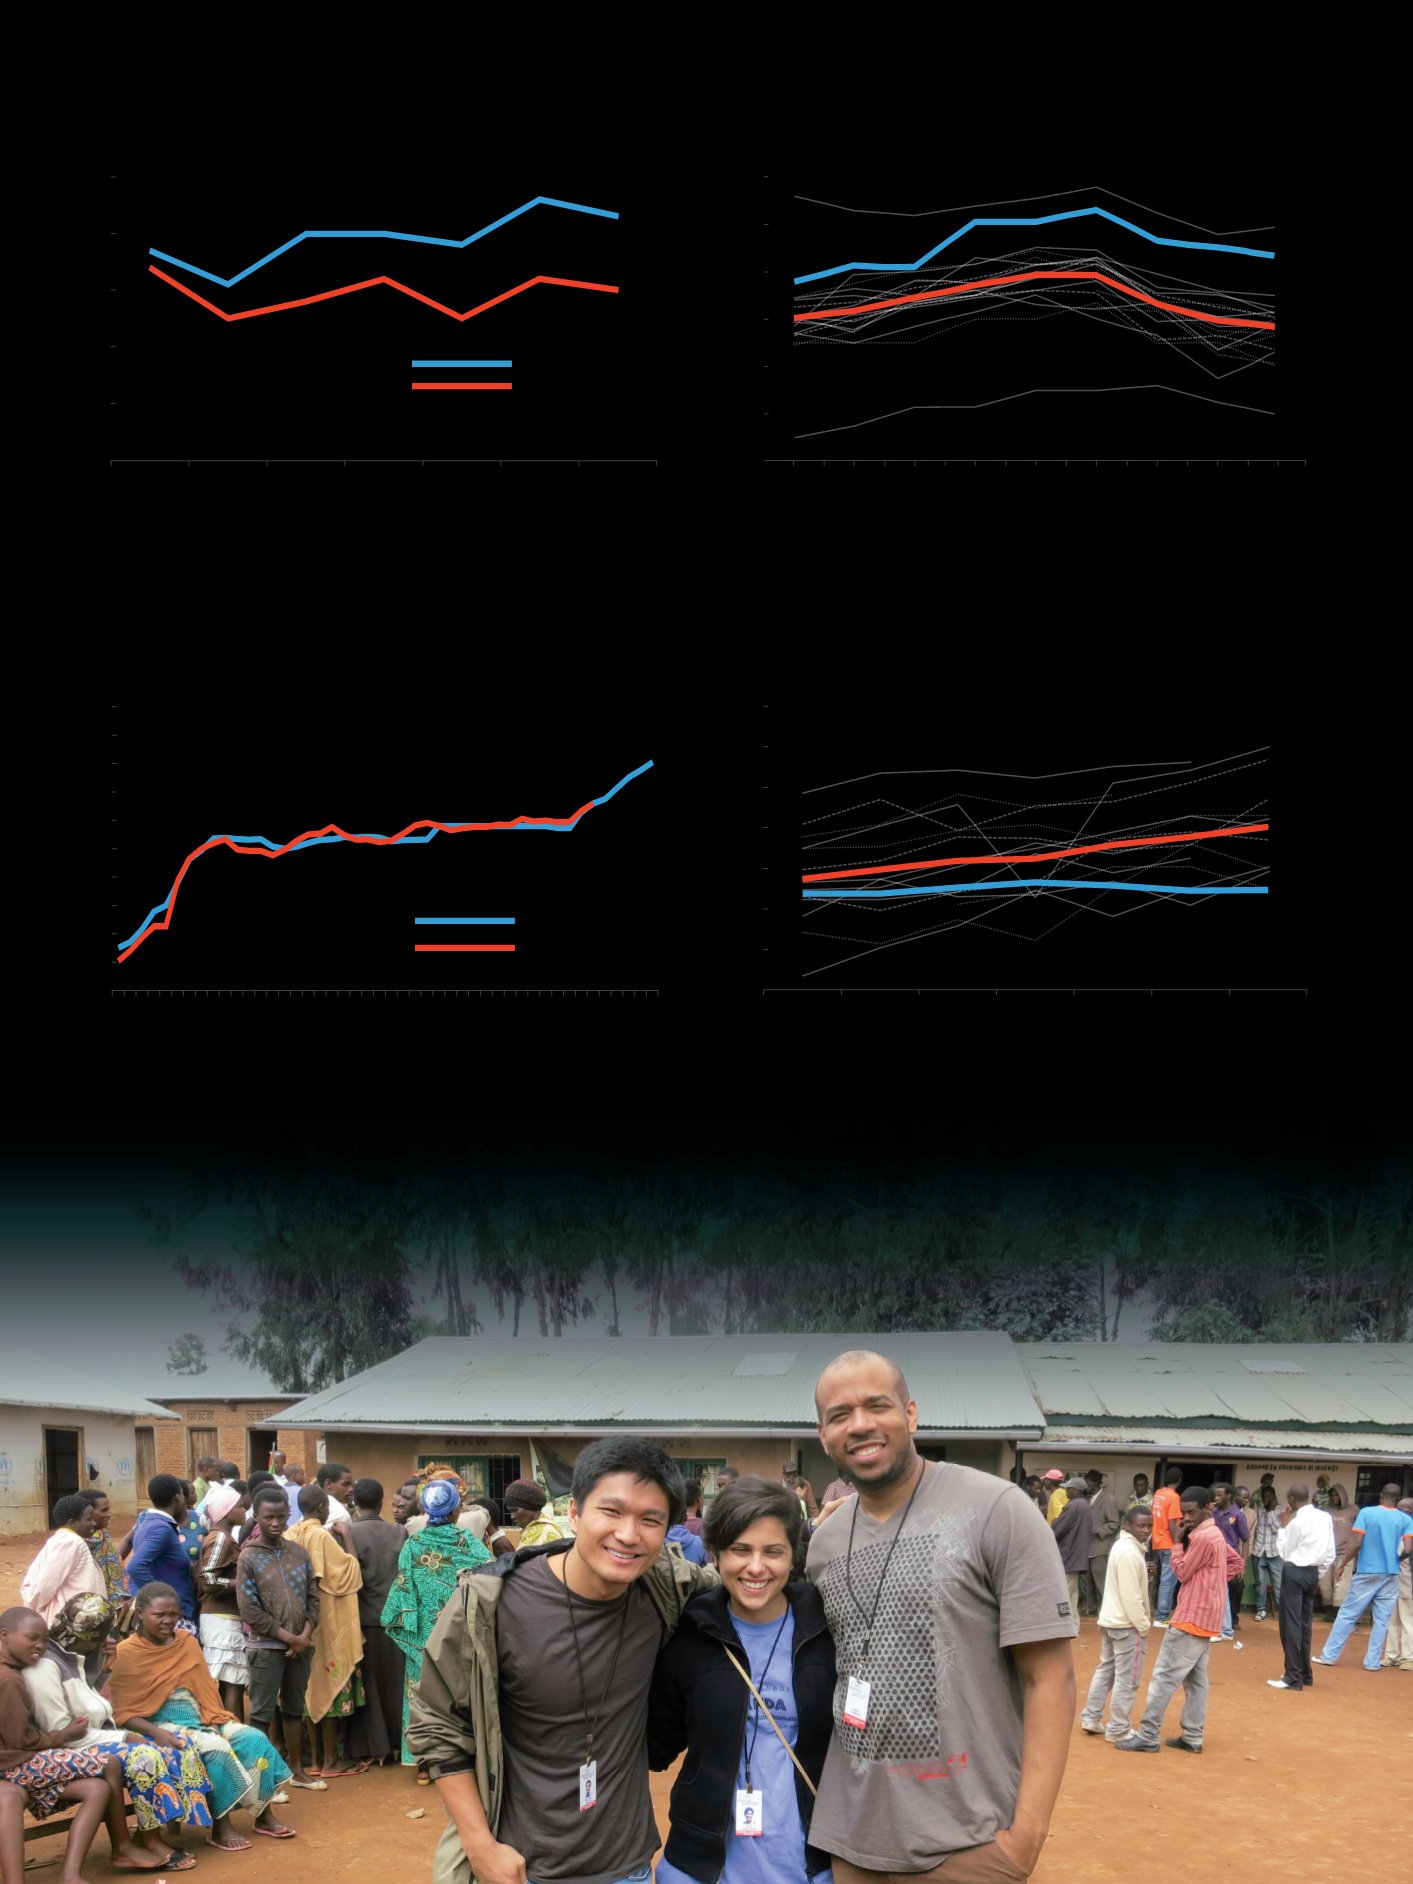
Entering OAT Total Science Scores by School PerYear*
OAT TS
3.6
3.5
3.4
3.3
3.2
3.1
2006
2007
2008
2009
2010
2011
2012
OAT TS
100%
95%
90%
85%
80%
75%
70%
65%
2002
2003
2004
2005
2006
2007
2008
2009
2010
2011
2012
Entering GPA and Science GPA
NBEO Part II (Patient Assessment and Management)*
Entering OAT Total Science Scores by School Per Year*
* Each thin line represents a school or colleg of optometry.
SUNY
National
Entering Year
o a t t s
100%
95%
90%
85%
80%
75%
70%
65%
60%
55%
5
2003
2004
2005
2006
2007
2008
2009
2010
2011
2012
2013
NBEO Part I | Applied Basic Science
Historic Enrollment (Professional and Graduate Programs
1972
1974
1976
1978
1980
1982
1984
1986
1988
1990
1992
1994
1996
1998
2000
2002
2004
2006
2008
2010
2012
2014
2016
100%
95%
90%
85%
80%
75%
70%
65%
2002
2003
2004
2005
2006
2007
2008
2009
2010
2011
2012
NBEO Part IIII (Clinical Skills)*
Historic Enrollment (Professional and Graduate Programs)
Planned
Actual
Y e a r
National
SUNY
380
360
340
320
300
280
260
2004
2005
2006
2007
2008
2009
2010
2011
2012
Entering OAT Total Science Scores by Scho l PerYear*
OAT TS
National
SUNY
200,000
180,000
160,000
140,000
120,000
100,000
80,000
60,0 0
2006
2007
2008
2009
2010
2011
2012
Optometry school indebtedness of students who took out loas by school
OAT TS
Optometry School Indebtedness of Students Who
Took Out Loans by School*
DEBT ($)
Year of Graduation
* Each thin line represents a school or college of optometry.
SUNY
National
3
3
3
3
3
2
2
2
2
20 ,00
180,0
160,0
140,0
120,00
,
80,0
60,
2006
2007
2008
2009
2010
2011
2012
Fourth year OD students Quy Nguyen and Julia Canestraro with SUNY alumnus and faculty member Dr. Andre Stanberry
(right) on a
Student Volunteer Optometric Services to Humanity
trip to a refugee camp in Rwanda last January.


